Further observability of a Traefik instance

In my last article in which I presented an overview of Traefik I was pointing out a lack of visit statistics in the dashboard. Fortunately, it is possible to visualize this information and we will see how in this article.
Traefik comes with the ability to expose metrics in a language that Prometheus understands.
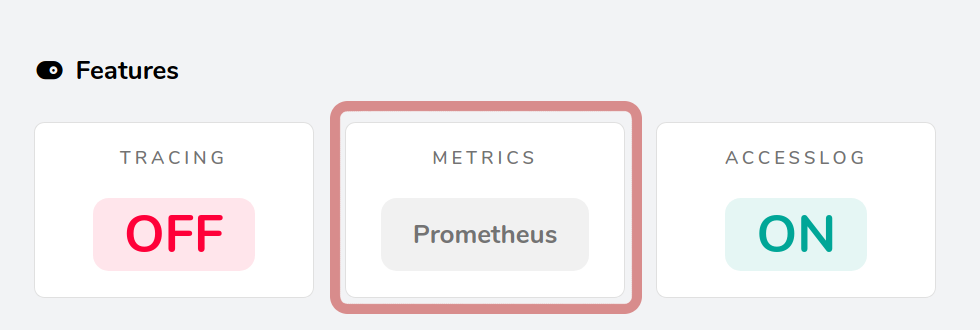
Once enabled, we can see this icon in the Dashboard
These metrics give us information about :
In the scope of this article we will mainly focus on the last (but not least) category.
Once we have configured Prometheus to scrape the Traefik metrics enpoint, we can query the metrics using the PromQl language.
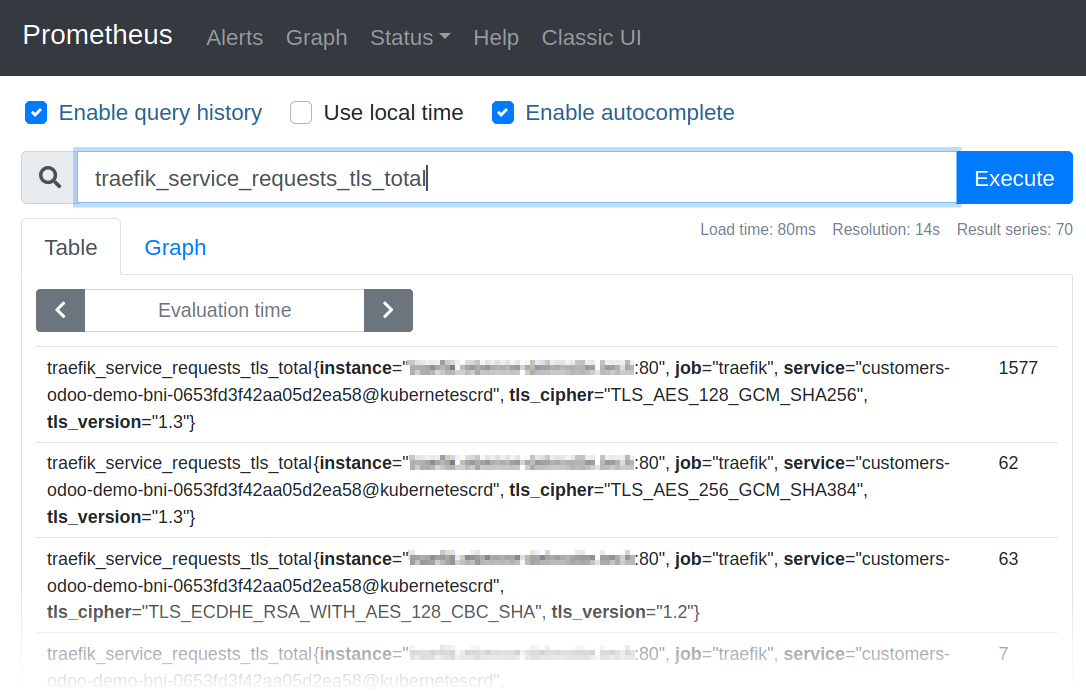
For our visit statistics use case, the right metric is traefik_service_requests_tls_total. We can simply enter the name of the metric in the query editor and we will see the result.
We get the total number starting from the moment we lauchned Traefik.
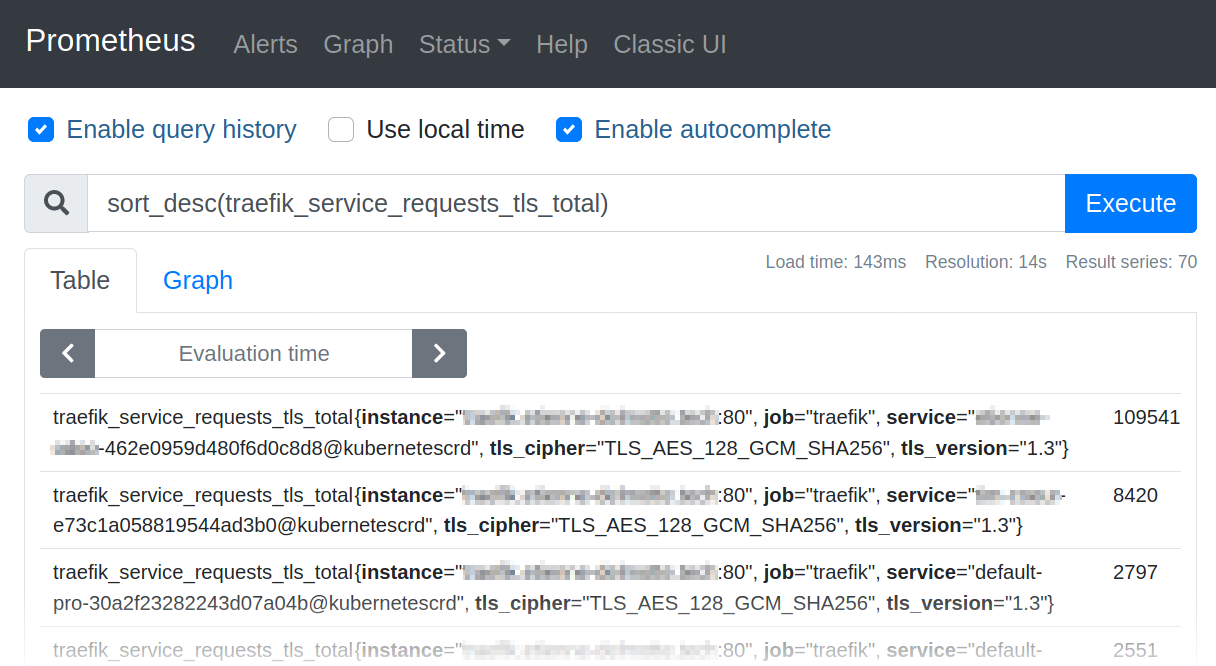
If we want to see the most popular first we simply apply the sort_desc query function :
Now we can go to the graph tab to get a visual representation.
We will group requests in bins of one minute duration with the following request : rate(traefik_service_requests_tls_total[1m])
Then we get a beautiful graph :
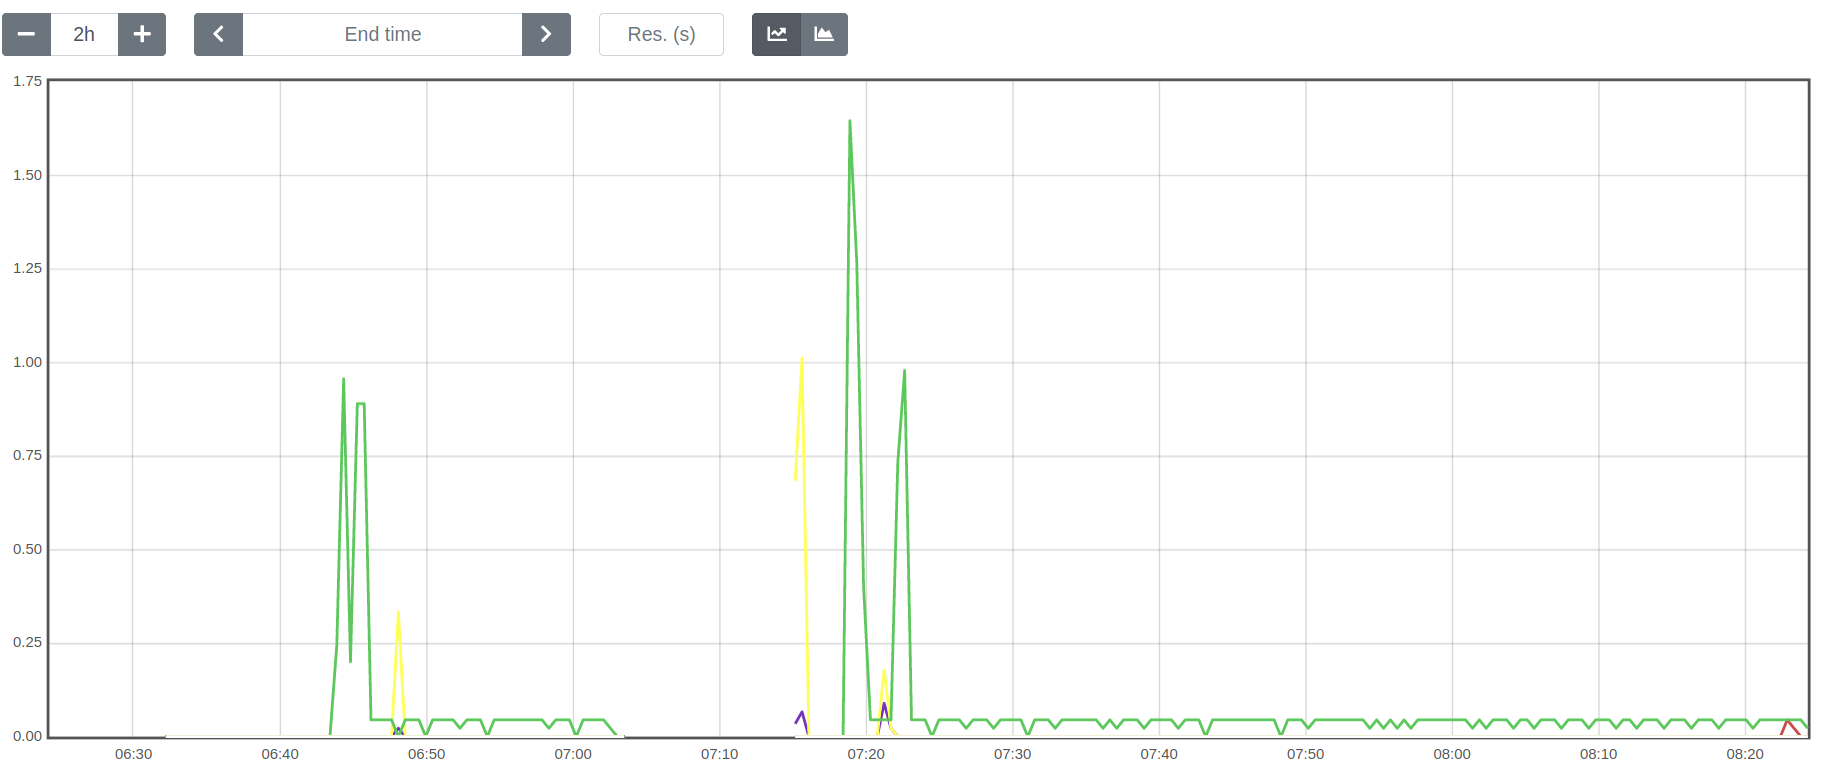
The spikes show some visitors on our websites, and the little purr is the result of a single page app in which the front-end regularily tests the back-end's responsiveness.
Awesome ! Now we can have a sense of how our services are used.
This is nice but when we want to have the Prometheus graph updated we need to execute the query again. In fact the purpose of Prometheus is to gather and expose the metrics, not to be a full-featured visualization tool.
In order to have a more convenient dashboard, we will use the Traefik dashboard published by the Grafana community.
Among all the panels we can see one similar to what we had in Prometheus.
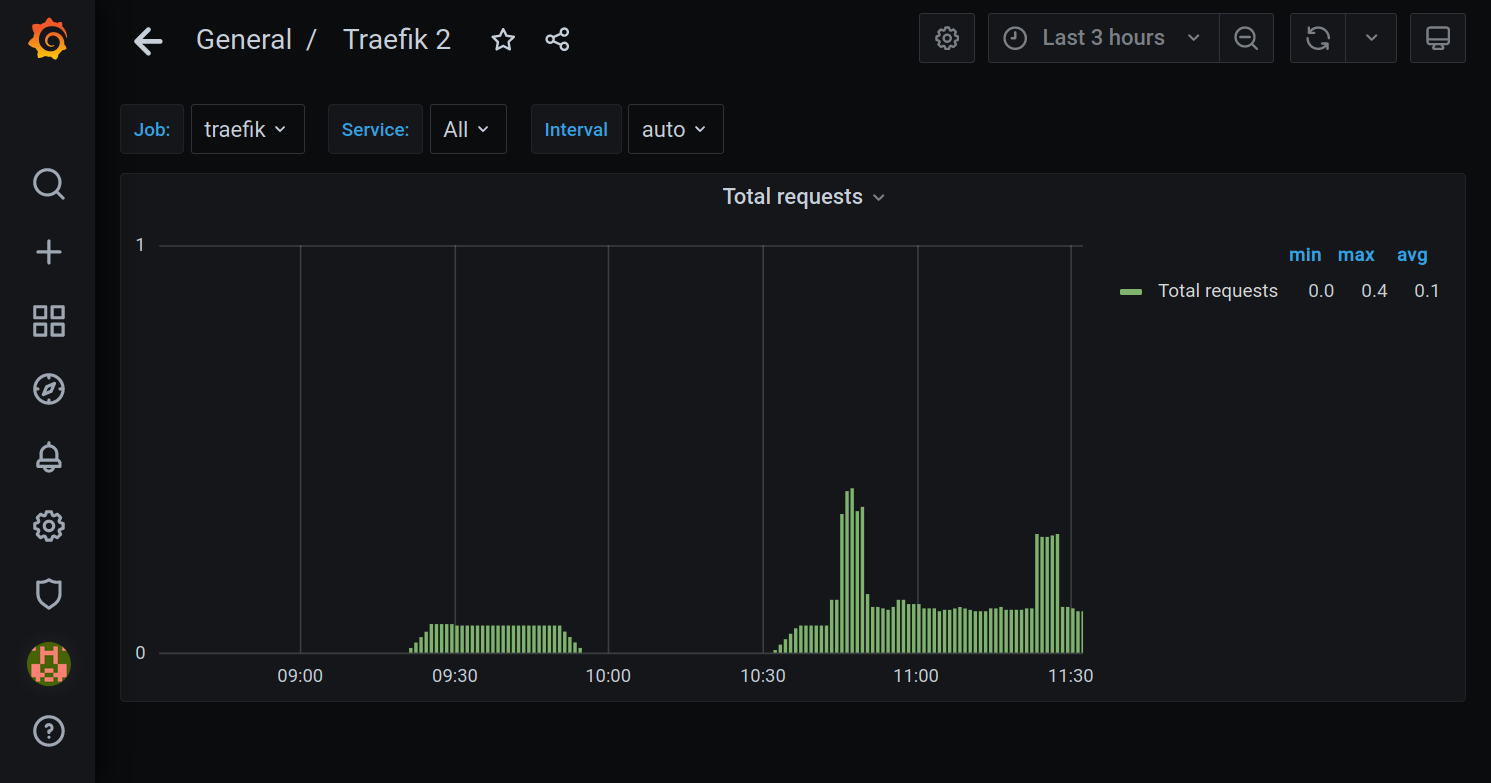
But there is a difference. In Prometheus we were able to distinguish services. Can we do the same in Grafana ?
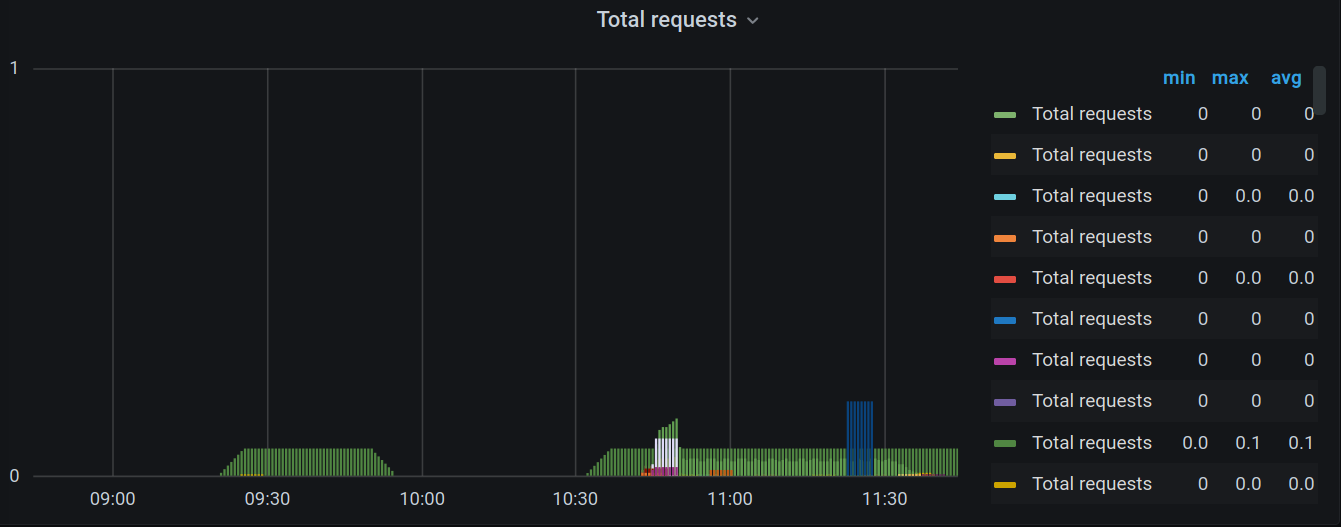
When we edit the panel we can see it uses the following query.
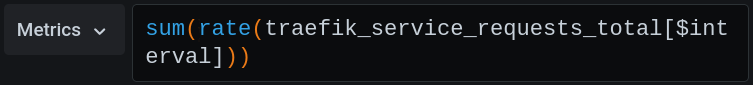
Then we just have to remove the call to sum function to have the same graph.
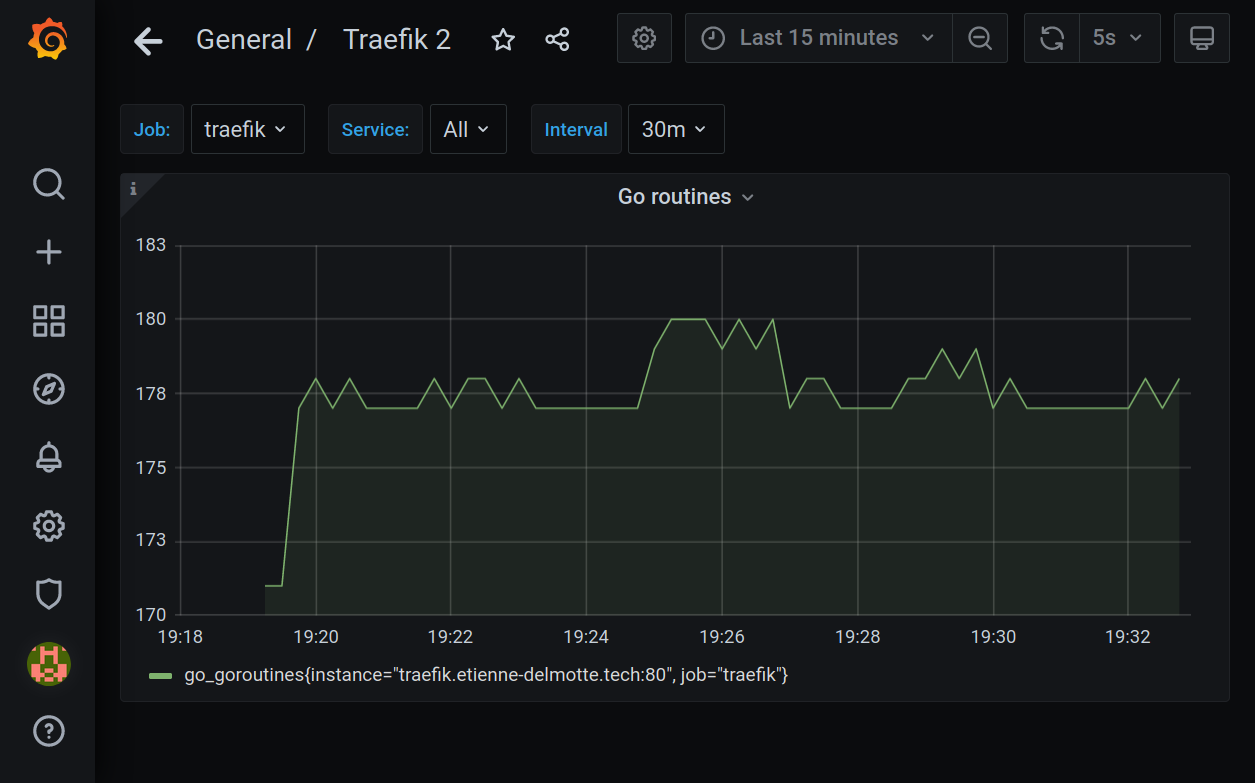
Then how about setting up a brand new panel ? Let us create one using the go_goroutines query.
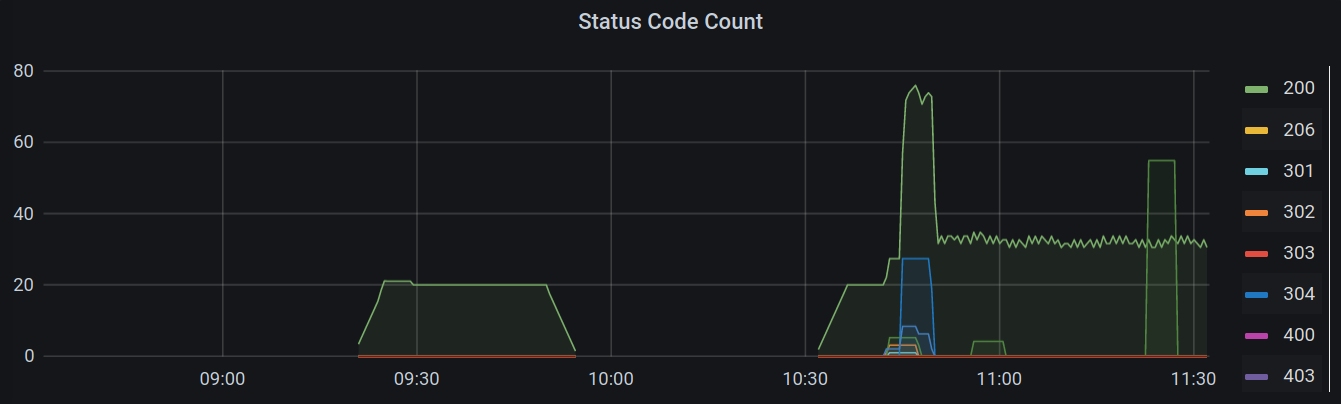
Among all the panels of this community Dashboard I have a crush for the status code count, because it gives both observability over the popularity and errors. Two notions in a graph that remains very readable.
Using Prometheus and Grafana it is possible to get observability over a Traefik instance. Grafana offers the ability to quickly setup a dashboard using the work from community. We can also create our own panels.
I think Traefik engineers purposefully chose to delegate monitoring to third-party tools.
Interested in monitoring your services using state-of-the art tools ?
Drop me an email at consulting@etienne-delmotte.tech ;)
Copyright © 2020 Inovatik - All rights reserved