Monitoring quality of service
March 2022

Two points of view may be considered when monitoring a service. An idealistic approach could be to make sure all internal components work as expected. But such a setup is time-consuming in implementation, and noisy in operations. In addition, several commonly used systems nowadays are designed to be fault-tolerent, meaning an internal component failure does not necessarily lead to a service degradation. For example an etcd node can be down without compromising the ability to read and write in its key-value storage.
A more pragmatic approach is to watch over what could harm the user experience. Even if measuring something subjective and multi-faced is not easy, it is known people generally like a quick-responsive application.
How to be aware when our service falls short in responsiveness ? In this article I will demonstrate a solution for this.
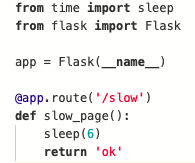
We start with a similar architecture as the one presented in my last article. But this time there are two additional components. First a simple Flask endpoint that sleeps for 6 seconds will play the role of a poorly performing service.
Second we deploy a Prometheus Alert Manager that will receive alerts from Prometheus server.
Then we configure Prometheus to pick the right information from Traefik metrics and send an alert when there is at least one response time above 5 seconds on a 1 minute time frame.
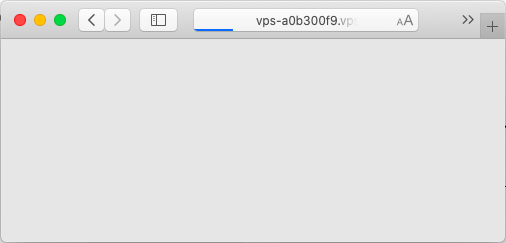
Once the configuration is finished we visit the slow endpoint and see the browser takes time to load the page.
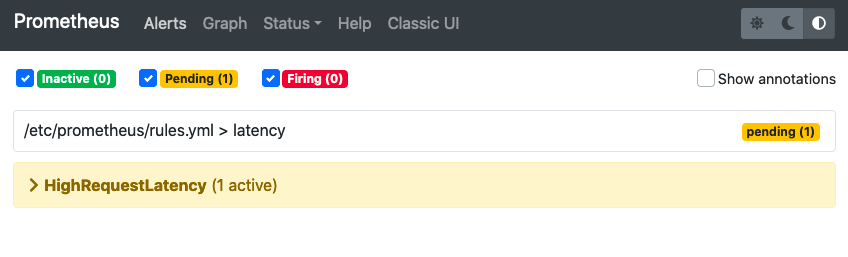
And we can see Prometheus is aware of the anomaly.
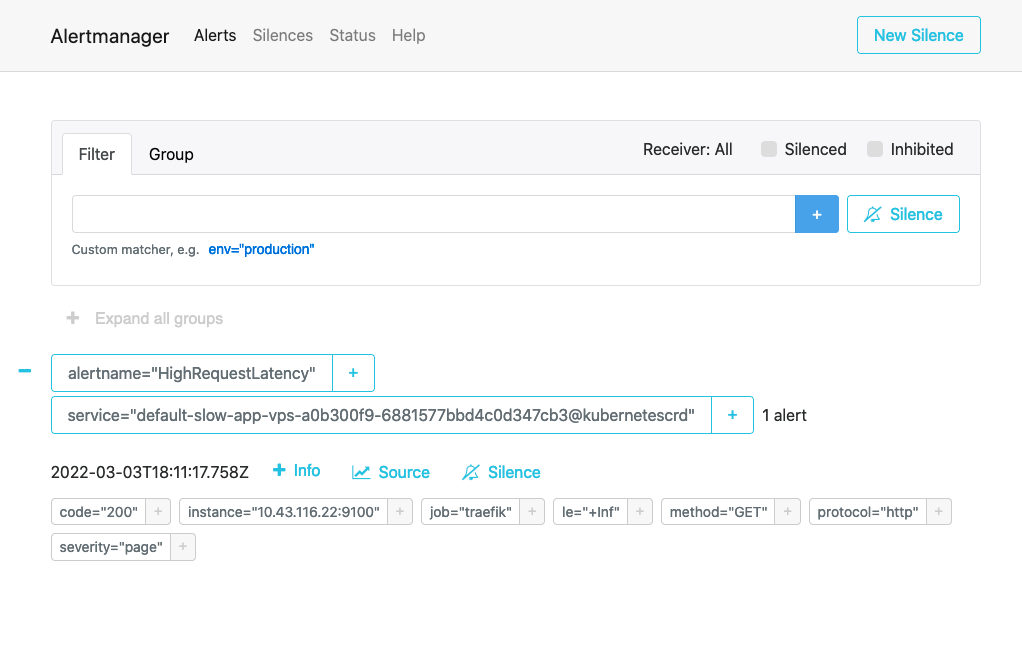
Upon anomaly detection, Prometheus has notified the Alert Manager.
There we are. If a user of our service has a poor experience because of a page slowness our system will detect it. Then the alert manager can be configured to send a notification to a bunch of different systems (email or pager for example) which choice depends on the team context.
Interested in monitoring the quality of your service ?
Send me an email at consulting@etienne-delmotte.tech
Copyright © 2020 Inovatik - All rights reserved