Analyzing performance issue
May 2022

In my last article I presented how to be aware when a website is too slow to answer, using Traefik and Prometheus. This is crucial, but not sufficient. We need to spot precisely which part of the system is faulting so we can correct it. But how can this be achieved ? I present here a solution using Open Telemetry and Jaeger.
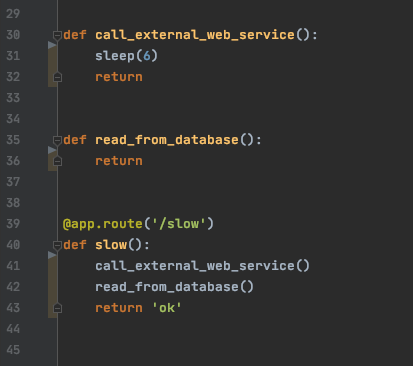
For this sake we will use an application where the bottleneck is purposefully put and see if the tool empowers for a correct diagnosis. We add two more functions under the slow Flask view of the previous article. The first in the execution flow will mock a call to an external web service that is slow to answer. The second will play the role of a quick query to a local relational database.
Now we have this structure we integrate the Open Telemetry Python library.
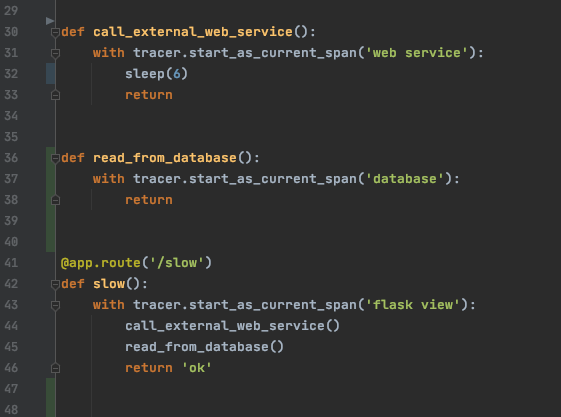
This will drop time stops as the execution goes on.
Now we will deploy a Jaeger backend that will reveive the traces and store them in its database. Here is the Kubernetes deployment:
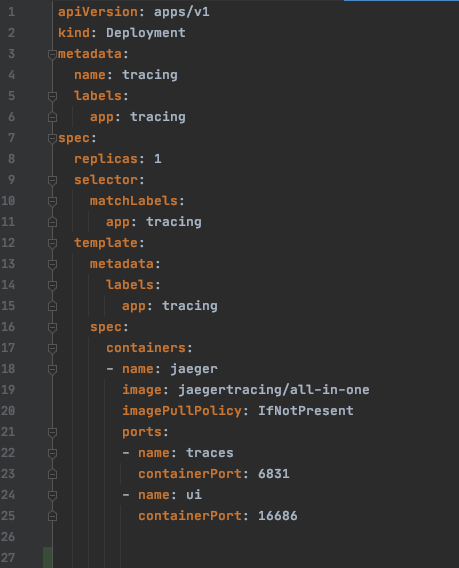
You can see here that we have two ports onto the container. One though which the traces will be received and the other that will provide the UI.
Sweet. Now, once all of this is deployed and the Flask endpoint has been called, we can explore the traces inside Jaeger UI.
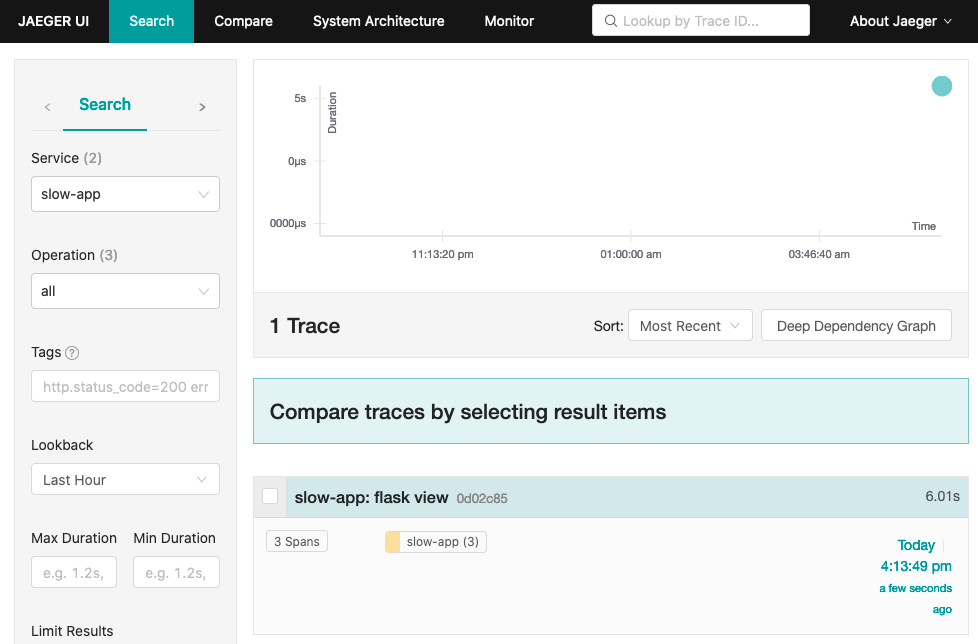
This is a high level view from which we can drill down.
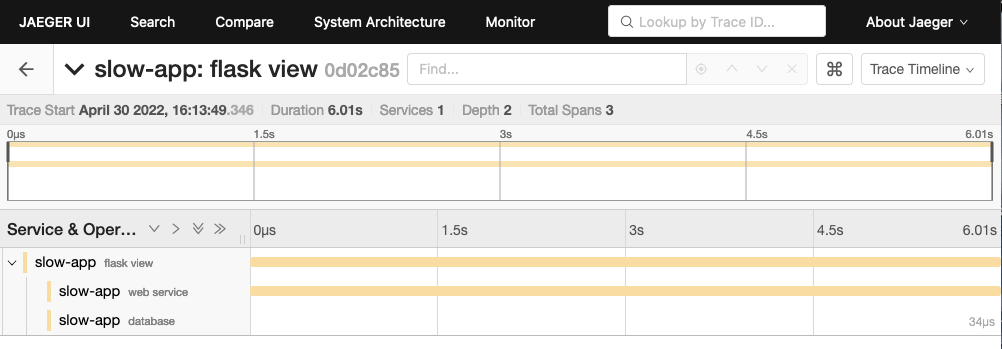
We can see that the Flask view has first called the web service, which took 6 seconds. Then it queried the database which was instant. Now we have spotted the issue.
Using Open Telemetry and Jaeger we are able to find the bottleneck in an application. Here the example was simple but in real world systems we may have a hundred functions from different instances of software inside different pods. So having a centralized backend for traces is really helpful. Here in the code we explicitly wrote some calls to generate traces. But for a bigger piece of software we would have chosen the integration method that does not require changing the code.
Finding the bottleneck is the starting point of the investigation and opens the way to a fix. In our scenario we can imagine the web service we are calling is a weather forecast that changes only each 6 hours. So we query it using a cron job and store the result in our database. As our database is quick to answer, we solve the performance issue !
Do you have performance issues in your website?
Contact me at consulting@etienne-delmotte.tech
Copyright © 2020 Inovatik - All rights reserved